Epicor launches its Global Growth Index to monitor business growth performance in manufacturing
Globally, manufacturing business growth has increased by 3.7 percent (to 103.7 index points)[i] despite the fact that half of manufacturers admit they have grown under challenging circumstances. This is one of the key findings of the annual Global Growth Index, launched today by Epicor Software Corporation, a global provider of industry-specific enterprise software to promote business growth.
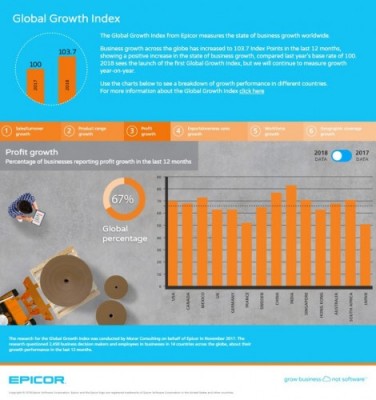
The Growth Index is designed to measure the state of business growth worldwide by tracking the performance of manufacturing businesses in 14 territories. Taking last year’s results as a base figure (100), it has found that business growth across the globe has increased by 3.7 index points in the last 12 months, awarding the state of business growth with a score of 103.7.
 Contributing to this score is a significant growth in the number of manufacturers reporting strong sales/turnover in the last 12 months—up 5 percent from last year to 70 percent overall. A similar trend was observed with profits and product ranges, with a 3 percent boost in the number of businesses growing in each of these areas compared to last year.
Comparing figures on a global scale, the Global Growth Index shows a mixed performance from the USA—with manufacturers in this country outperforming global average figures in terms of expanding product ranges (66%), profits (70%) and workforce (54%), but underperforming in terms of geographic expansion (44%), and exports (also 44%).
Manufacturing businesses in Mexico, India, and China, meanwhile, came above global average figures in all growth metrics, with the exception of workforce growth, which was reported by just 39 percent of Chinese businesses, compared to a global average of 48 percent. European businesses have been most likely to experience growth in terms of geographic coverage and exports/overseas sales–French and Swedish businesses have lead the way here, with over half growing in these areas, compared to 44 percent of UK businesses and 46 percent of German businesses.
Global Growth Index figures
The table below illustrates the Global Growth Index results for 2018, compared to 2017. Percentages illustrate the median average number of businesses that have reported growth in each of the key growth metric areas. For more detailed statistics and to compare the results of different countries, please see the Global Growth Index infographic.
|
Growth metric |
Global average (%) 2017 |
Global average (%) 2018 |
|
Sales/ turnover growth |
65% |
70% |
|
Product range growth |
61% |
64% |
|
Profit growth |
64% |
67% |
|
Exports/ overseas sales growth |
49% |
51% |
|
Workforce growth |
48% |
48% |
|
Geographic coverage growth |
49% |
51% |
Figure 1. Percentage of businesses reporting growth – 2018 and 2017 comparison (median averages)
Comparing US business performance
US manufacturers showed mixed success in terms of their ability to grow, compared to their international counterparts, on most key areas of growth.
|
Growth metric |
Global average (%) |
US businesses growing in this area (%) |
|
Sales/ turnover growth |
70% |
70% |
|
Product range growth |
64% |
66% |
|
Profit growth |
67% |
70% |
|
Exports/ overseas sales growth |
51% |
44% |
|
Workforce growth |
48% |
54% |
|
Geographic coverage growth |
51% |
44% |
Figure 2. Percentage of businesses reporting growth – US and global comparison (median averages)
Despite this worldwide increase in business growth performance, almost half (45%) of businesses also admitted that the growth they had experienced in the last 12 months had been challenging and one-in-four (23%) said it had been stressful. However, half (46%) of businesses globally also agree that investing in new/better technology is a strategy that will help them overcome their growing pains.
“Although we have seen impressive overall rates of growth this year, there’s an underlying consensus among the businesses we surveyed, that growth hasn’t been easy to achieve,” said Scott Hays, senior vice president, product marketing, for Epicor.
“Nevertheless, businesses in the manufacturing sector have also affirmed that investing in the right technology will help position themselves for growth in the future. With automated systems reaching production lines around the world, cloud adoption continuing to rise, and enterprise resourcing planning (ERP) solutions transforming the way businesses manage workflows and share their data, this is a sentiment that we will track year-on-year,” he concluded.
The Global Growth Index research will be updated by Epicor on a yearly basis. For more information about the global trends and the methodology, please view the online infographic.
[i] The research for the Global Growth Index was conducted by Morar Consulting on behalf of Epicor in December 2017. The research questioned 2,450 business decision makers and employees in businesses in 14 countries across the globe, about their growth performance in the last 12 months.
Epicor Software Corporation drives business growth. We provide flexible, industry-specific software designed to fit the precise needs of our manufacturing, distribution, retail, and service industry customers. More than 45 years of experience with our customers’ unique business processes and operational requirements are built into every solution―in the cloud or on premises. With this deep understanding of your industry, Epicor solutions dramatically improve performance and profitability while easing complexity so you can focus on growth. For more information, connect with Epicor or visit www.epicor.com.
# # #
Epicor and the Epicor logo are trademarks of Epicor Software Corporation, registered in the United States and other countries. Other trademarks referenced are the property of their respective owners. The product and service offerings depicted in this document are produced by Epicor Software Corporation.
